LIMITED TIME OFFER: Get a Free MTPS Sensor with Your MP Series Purchase – Offer Ends August 31, 2025!
Thermal Conductivity Measurements on Milk
Published on November 21, 2018
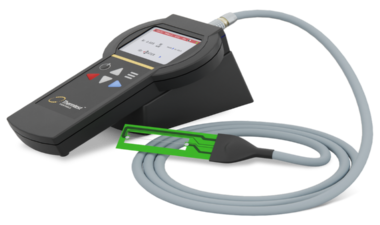
The Thermtest THW-L2 is a thermal conductivity meter based on the Transient Hot Wire method for testing the thermal conductivity of fluids. In this example milk is used to demonstrate the sensitivity of the device.
Testing fluids with a THW-L2 is easy and fast. Each measurement is only ca 1 second long and the sensor wire is gently heated with ca 3 °C during each experiment. However, it is important to allow the sample to reach thermal equilibrium between tests, and it is therefore suggested to wait a few minutes between tests and allow temperature to fully stabilize if testing is performed at several temperatures. In this example, the measurements on each samples were repeated four times at the specified temperature to demonstrate measurement precision.
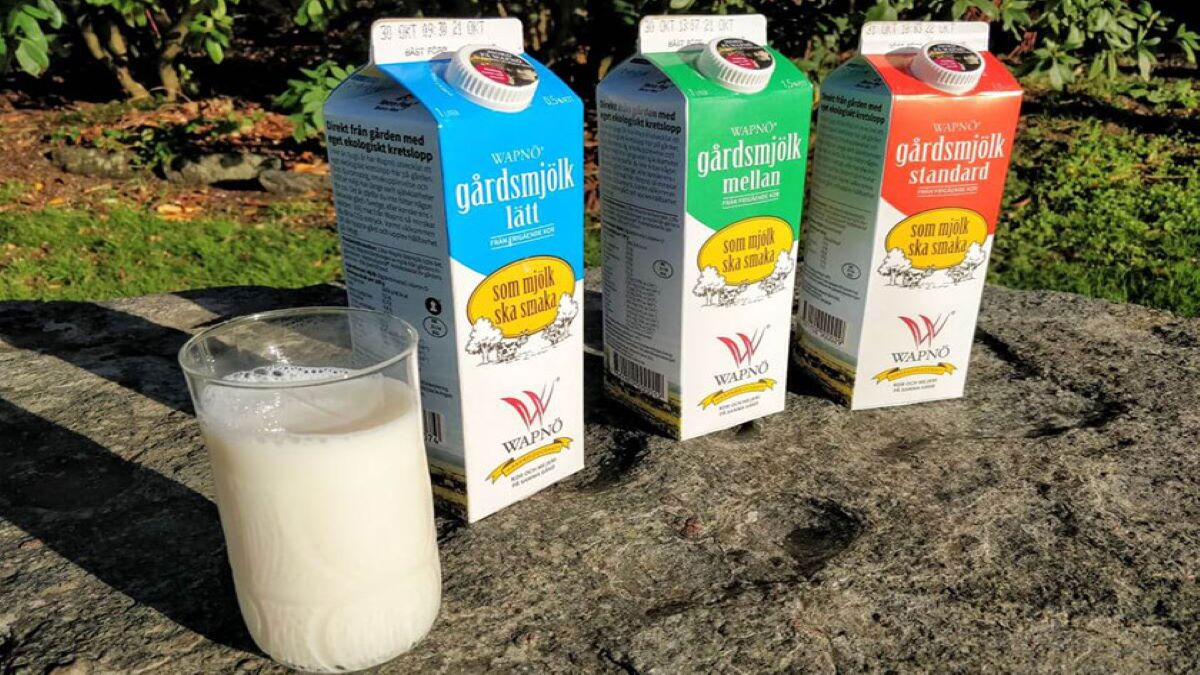
The analysed milk was produced at the local Wapnö diary outside of Halmstad, Sweden. All three types of milk were processed at the diary within a time period of 24 hours, so quality should be very similar between the batches.
Milk is a popular drink here in Sweden and you can get it in a range of qualities. Most popular is low-pasteurized milk with 0.5 %, 1.5 % or 3.0 % fat. There is also high-pasteurized milk available as well as milk with no lactose etc. But in this little example we will focus on the most popular types, locally referred to as “normal milk”.
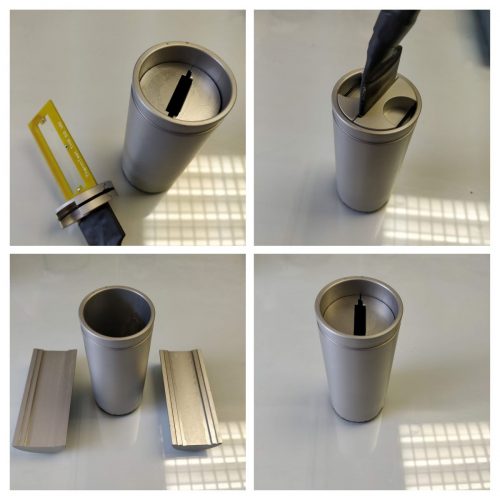
As fresh milk should be stored chilled, all measurements were performed at 4 °C. The volume of liquid needed for a test like this is ca 25 ml. The THW sample container and sensor used for these tests can be seen in the picture below.
THW-L2 sensor and sample holder
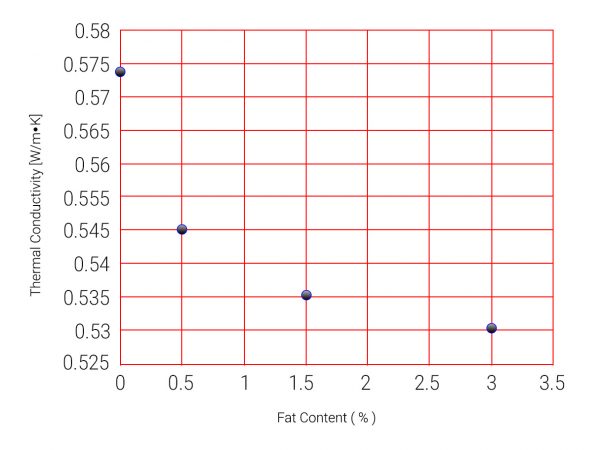
The accuracy and precision of the THW-L2 thermal conductivity meter is excellent as demonstrated by the data that follows. From the results it is possible to distinguish the different types of milk as a clear trend is present: The thermal conductivity is reduced as the fat content increases. As a reference, also deionized water was tested. The DI water follows the trend, with the highest thermal conductivity.
The measured data is presented in the below table and graph.
Fat content [%]
Thermal Conductivity [W/m/K]
Standard deviation
DI Water
0.574
0.0023
0.5
0.545
0.0033
1.5
0.536
0.0019
3.0
0.531
0.0025
The thermal conductivity of milk. The data point at 0 % represent DI water.
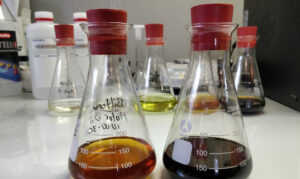
Do you find these results interesting? Maybe you would like to test similar fluids? At Thermtest Europe we offer both thermal conductivity testing services and thermal conductivity meters. The THW-L2 is great for testing everything from solvents and nano-fluids to emulsions, oils and thick liquids like syrups.


![Thermal and Physical Properties of 7-Methyl-1,5,7-triazabicyclo[4,40]dec-5-ene](https://thermtest.se/wp-content/uploads/2019/10/7-Methyl-157-triazabicyclo4.4.0dec-5-ene-1-150x89.jpg)