LIMITED TIME OFFER: Get a Free MTPS Sensor with Your MP Series Purchase – Offer Ends August 31, 2025!
Thermal Conductivity of Water
Published on February 11, 2021
Introduction
According to literature1 the thermal conductivity of water is 0.598 W/m·K at 20 °C. Here the limits and accuracy of the Thermtest THW-L2 thermal conductivity meter for fluids is explored by testing a selection of water samples.
For calibrating the THW-L2, deionized ultra-filtered (DIUF) water is used. With a so calibrated instrument the thermal conductivity of a set of water samples was tested: DIUF water, distilled water, tap water, a 5 mass% sugar solution, and a 5 mass% salt solution.
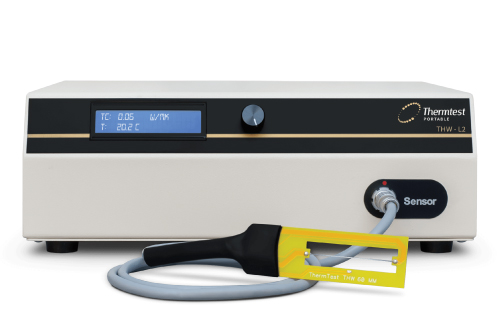
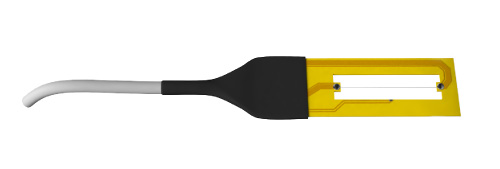
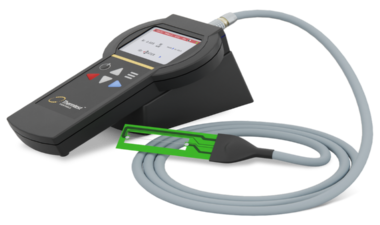
THW-L2 Liquid thermal conductivity meter
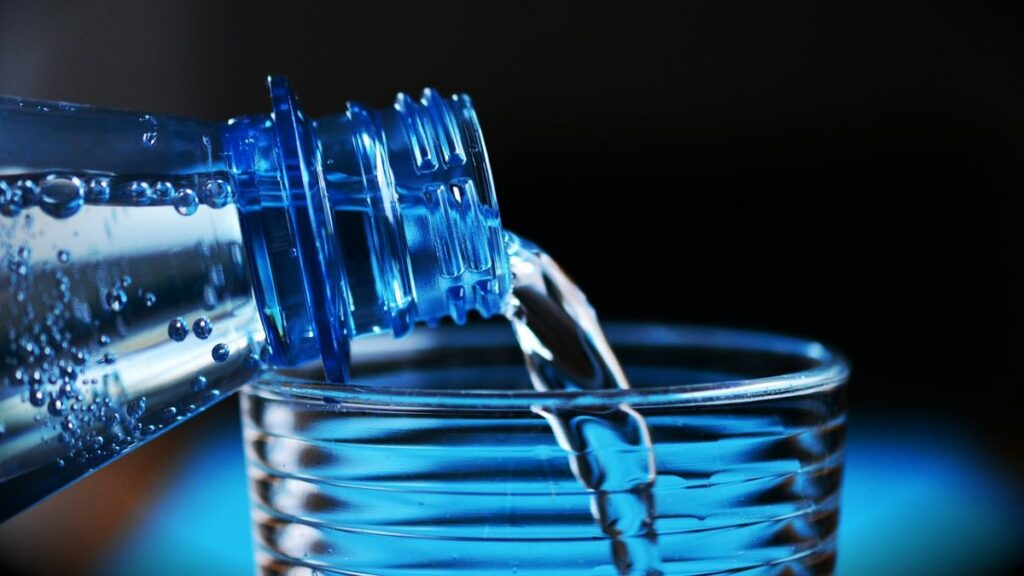
The Samples
Retesting DUIF water certifies that the calibration is good and provides a baseline for the precision of the method. Distilled water is readily available in most hardware stores and can potentially be used as a low-cost calibration material. Tap water varies from location to location and the here used water is from Veddige, Sweden. It is excellent drinking water, not chlorinated and have a hardness of 4 °dH and pH 8.3. It was tested twice, first freshly poured and then again after settling overnight in an open container. Sugar and salt will impact water in difference ways and solutions of such are interesting examples to study.
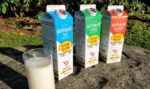
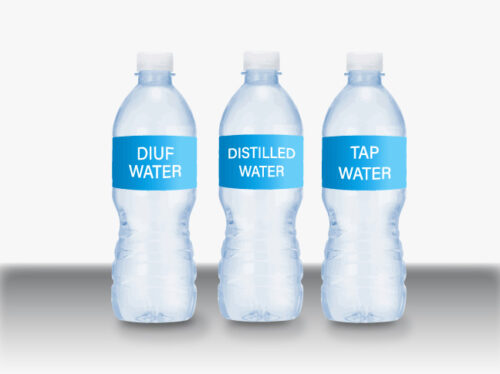
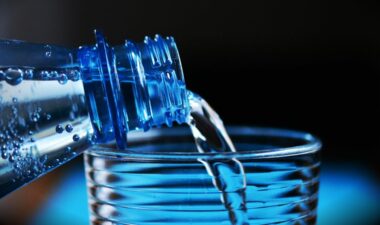
DIUF water, distilled water and tap water
Method and testing
All testing was performed with a Thermtest THW-L2 thermal conductivity meter, which is an advanced, yet affordable instrument for testing the thermal conductivity of liquids, pastes and gels with a thermal conductivity range of 0.01 to 2 W/m·K in accordance with ASTM standard D7896-19. For full details, please see the THW-L2 product page.
Sample temperature was controlled with a dry bath, which is operated through the THW software.
The THW-L2 sensor used for the experiments consist of a bare 60 mm alumel wire and a pt-100 temperature sensor. During a test, the probe is fully immersed in the fluid sample and the thermal conductivity is derived from the temperature increased of the wire during the measurement time, which is 1 second long. The heating power is automatically detected and optimized by the instrument software.
THW-L2-Sensor
All tests were performed at 20 °C and the sample volume used was ca 20 ml for each sample. For each specimen, the testing was repeated 6 times with 10 minutes between tests, to demonstrate the stability in the results.
Results of Thermal Conductivity of Water
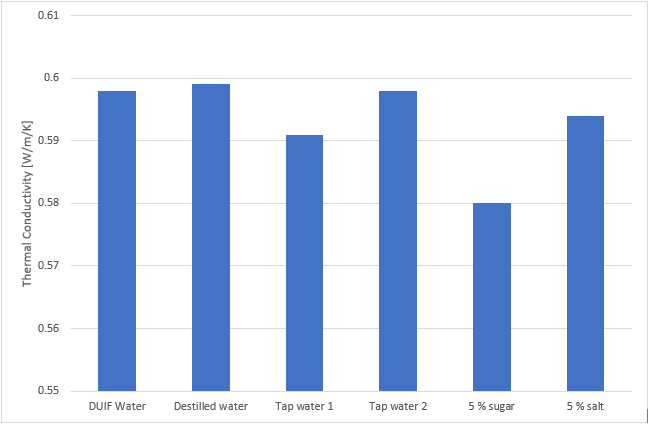
Table 1. The Thermal Conductivity of water of different quality. Presented data are average values from six repeated tests on each sample. Standard deviation is close to 0 %. Full data sets showing the excellent precision of the THW-L2 are found in the appendix below.
SAMPLE
THERMAL CONDUCTIVITY [W/m·K]
DIUF Water
0.598
Distilled Water
0.599
Tap Water Fresh
0.591
Tap Water Settled
0.598
5 mass% Sugar Solution
0.580
5 mass% Salt Solution
0.594
As can be seen, DIUF, distilled and tap water show very similar results. Freshly poured tap water shows a slightly lower value, likely due to air trapped in the fluid. The value then goes up after settling overnight, allowing the gas to leave the sample.
Adding sugar to water clearly reduces the conductivity, while salt has a more limited impact. It should here be noted that care must be taken when a salt solution is tested. With the addition of salt, the electrical conductivity of the water is greatly increased. This can interfere with the result if exposed areas of the probe, i.e. temperature sensor and solder joints, are not electrically insulated from the sample.
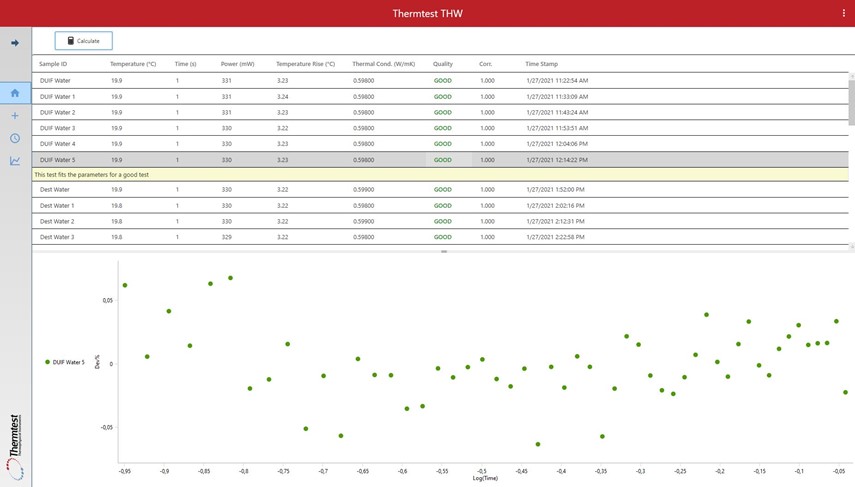
When testing thermal conductivity with the THW-L2, results are presented directly in the software as seen in the picture below. In the software, the testing parameters are presented along with the results and the quality of the data is automatically controlled. To allow the used to confirm good data or to detect anomalies, all data is graphically depicted with both transient chart and a residual plot. The residual plot shows if the experimental is correctly fitted to a straight line, which is a requirement for acceptable results.
Figure 1. Software view, showing results and residual plot.
Conclusions on Thermal Conductivity of Water
The THW-L2 proven capable of testing water with great accuracy and precision. It can be used to detect variations in water quality by looking at the thermal conductivity. It is also apparent that pure water, be it DIUF, distilled or high-quality drinking water has a very stable thermal conductivity at 20 °C.
Table 3. Thermal conductivity of distilled water, product name Ad TechLine Destvatten.
TEST #
THERMAL CONDUCTIVITY [W/m·K]
1
0.599
2
0.598
3
0.599
4
0.598
5
0.599
6
0.599
Table 4. Thermal conductivity of freshly poured tap water, 4 °dH and pH 8.3.
TEST #
THERMAL CONDUCTIVITY [W/m·K]
1
0.592
2
0.592
3
0.592
4
0.591
5
0.591
6
0.590
Table 5. Thermal conductivity of settled tap water, 4 °dH and pH 8.3.
TEST #
THERMAL CONDUCTIVITY [W/m·K]
1
0.599
2
0.598
3
0.599
4
0.598
5
0.599
6
0.598
Table 6. Thermal conductivity of 5 mass% sugar solution.
TEST #
THERMAL CONDUCTIVITY [W/m·K]
1
0.581
2
0.580
3
0.580
4
0.580
5
0.580
6
0.581
Table 7. Thermal conductivity of 5 mass% salt solution.
TEST #
THERMAL CONDUCTIVITY [W/m·K]
1
0.594
2
0.594
3
0.593
4
0.594
5
0.594
6
0.594
Graph: Average Results
1Huber, M.L., Perkins, R.A., Friend, D.G., and Sengers, J.V., Assael, M.J., Metaxa, I.N., Miyagawa, K., Hellmann, R., and Vogel, E. “New International Formulation for the Thermal Conductivity of H2O,” J. Phys. Chem. Ref. Data, 41(3), 033102, 2012. doi: 10.1063/1.4738955


![Thermal and Physical Properties of 7-Methyl-1,5,7-triazabicyclo[4,40]dec-5-ene](https://thermtest.se/wp-content/uploads/2019/10/7-Methyl-157-triazabicyclo4.4.0dec-5-ene-1-150x89.jpg)